In our previous posts, we have frequently discussed flowcharts as a way to represent processes. This widely recognized and accepted diagram is extremely useful for documenting processes and understanding exactly what happens and when.
However, it is important to know what each shape in a flowchart means, how flowcharts work in practice, and which tools are available to create and edit them.
From Simple to Complex
There are several recognized and accepted ways to represent processes. We will introduce the simplest and therefore most straightforward approach, as it is the most practical format to use. Overall, flowcharts can include the following elements:
- Steps
- Decisions
- Performers (responsible parties)
- Resources
Including responsible parties and resources in a flowchart is only advisable if we want to display them visually for external viewers. However, if we want the flowchart to remain somewhat flexible—meaning that performers and resources can be interchangeable—we do not need to include them. The diagram will still be understandable and provide a complete representation of the process. Furthermore, even in a medium-sized organization, many processes involve tasks that can be performed by several colleagues. For example, if five people handle document registration, any of them can be assigned the relevant tasks, so there is little point in showing a single responsible person on the diagram. If we use a process management tool to control our processes, this information can naturally be recorded in the appropriate places. The system will then “know” who should receive a particular task or how to distribute identical tasks among team members. (Note: Returning to the document registration example, as each document needs to be registered, the system assigns individual documents or document types to colleagues. In other words, the same step is repeated, but tasks can be assigned to different people, who perform the same step with different documents.)
Flowchart Direction
Flowcharts can essentially run in two directions, both of which show the chronological order of the steps:
- Left to right, or
- Top to bottom
using arrows that point in the corresponding direction. We use the second approach: the topmost element of the flowchart represents the first step, the element below it represents the second, and so on. Similarly, in a left-to-right diagram, the leftmost element represents the first step, and the element to its right represents the second.
Flowchart Elements
Steps
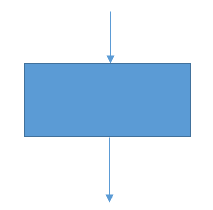
Process steps represent tasks to be performed: activities that a responsible party must carry out. They are shown as rectangles labeled with the name or main characteristic of the step.
Connectors
Individual process steps—whether tasks, decisions, or other elements—are linked using connectors. In practice, these are arrows placed between steps, with their direction indicating the process sequence. Notice that in the diagram above, there is a connector both above and below the rectangle representing the task. This means that the task is an intermediate step, preceded by another step and followed by further steps in the process.
Decisions
During a process, there are often several possible paths, depending on the decisions made by those responsible. These decisions can change the subsequent course of the process and create different branches. A decision may also concern the outcome of a previous step or an associated document: whether an invoice, for example, is acceptable. In such cases, rather than continuing along a different branch, the process stops at that point because the incorrect document is sent back to the person who performed the previous step for review. In some cases, of course, we can send the document even further back or incorporate review steps. The key point is that the document or other material generally returns to an earlier point in the process, and the relevant part of the process is repeated so that the incorrect document can be corrected and move forward properly. A good example from our previous post was an invoice approver who found the invoice content unacceptable and therefore sent it back to the finance department from which it had arrived.
Simple decisions made during a process—those with a yes/no answer—are represented as follows:
Here, the decision is expressed as a closed question, such as “Is the invoice acceptable?” The process can generally continue in either the Yes or No direction. (In other words, it proceeds along the Yes branch or the No branch.)
It is essential that every decision provides at least two possible paths for the process to follow; otherwise, the decision has no meaningful role. It is equally important to have properly defined process steps for both possible outcomes. Returning to the previous example, if an invoice is unacceptable and must be sent back, we need to specify exactly which step or responsible party it should return to. If necessary, we may also need to introduce corrective steps to ensure that the invoice cannot be forwarded again with errors.
Summary
Of course, complex process design goes well beyond the information outlined above. Many other types of diagrams exist to support different use cases. One example is a detailed data structure diagram for modeling software, which must include every field used and the path taken by every piece of data.
At Click On, we undertake end-to-end business process design, supported by our own software solution. Our goal is to provide our clients not just with software, but with ready-to-use, optimally functioning business processes that are guaranteed to improve efficiency.